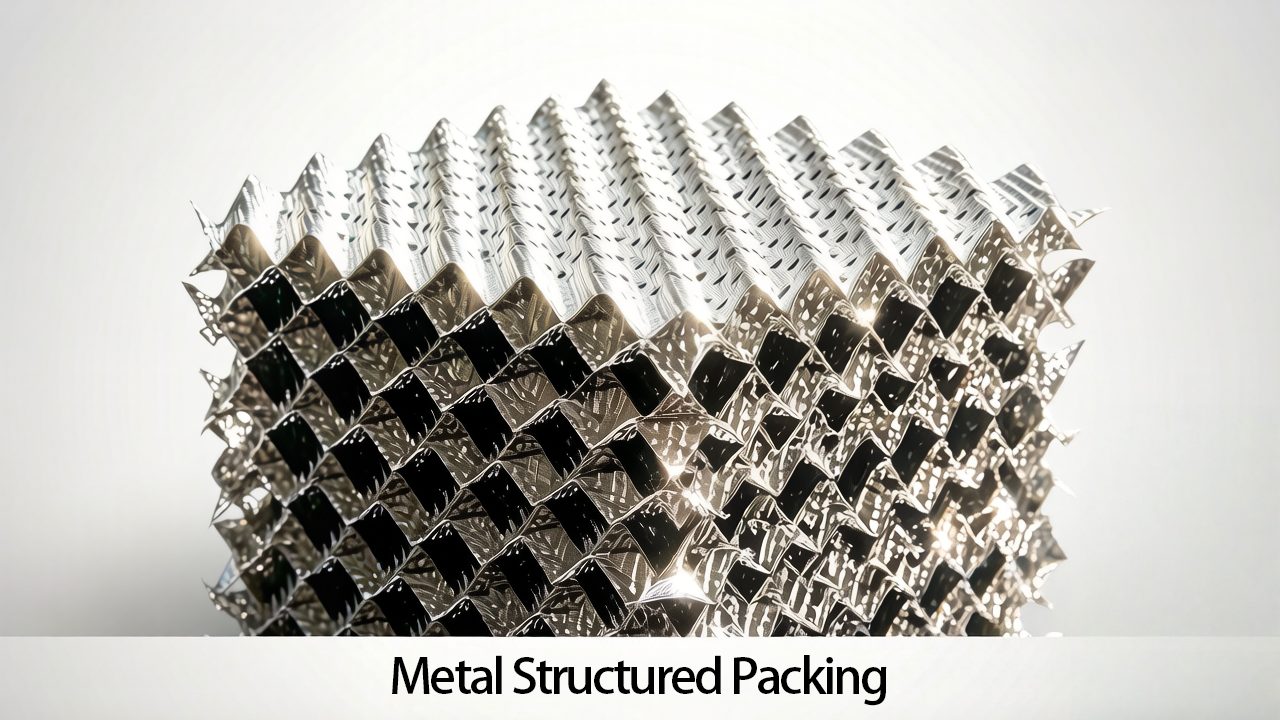
Metal Structured Packing Case Study
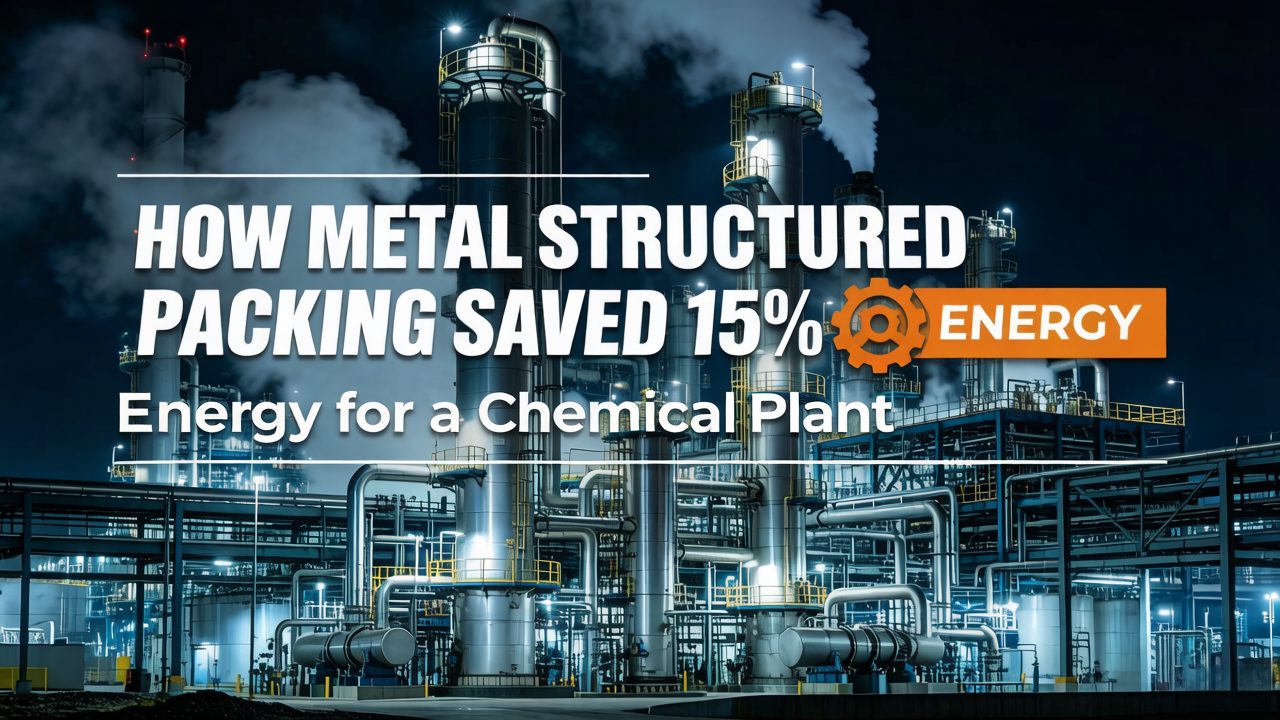
Executive Summary: 15% Energy Breakthrough Achieved
Facing rising energy costs, a mid-sized chemical plant achieved a 15% reduction in specific energy consumption through a strategic distillation column retrofit. By replacing outdated sieve trays with modern metal structured packing, the plant not only cut steam usage by 4.2 tons per hour but also increased product purity by 1.2% and reduced maintenance downtime by 67%. The $420,000 investment paid for itself in just 5.1 months, demonstrating how advanced mass transfer technology can deliver both environmental and economic benefits.
1. Industry Background & Market Trends
Global Market Overview
According to the latest industry reports, the global metal structured packing market reached $873.35 million in 2024 and is expected to grow to $1.317 billion by 2030, with a CAGR of 7.08%. China, as the global manufacturing center for chemical packings, currently accounts for nearly 55% of the world’s ceramic tower packing production capacity, with over 300 industrial ceramic factories.
Policy Drivers & Industry Transformation
Under the “Dual Carbon” goals, the chemical packing industry is undergoing structural transformation in 2026. The joint guidance from the Ministry of Industry and Information Technology and the National Development and Reform Commission, “Guidelines for High-Quality Development of the Petrochemical and Chemical Industry (2025-2030)”, explicitly requires that new packing production facilities must have energy consumption below 95% of the baseline, with approximately 34% of outdated capacity facing elimination or mandatory technical upgrades.
The Ministry of Ecology and Environment has further strengthened VOCs governance, with emission limits 40% stricter than before, forcing enterprises to upgrade to high-efficiency mass transfer packings.
Market Segmentation
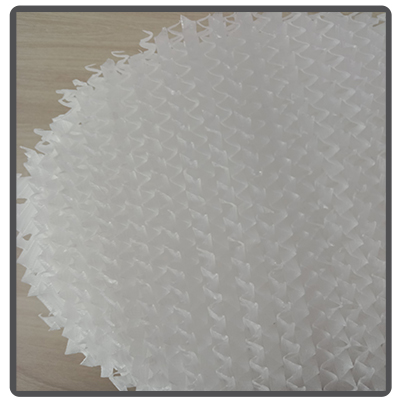
The market shows clear differentiation: structured packing dominates the high-end market with its high efficiency and low pressure drop advantages; random packing maintains stable demand in traditional environmental protection and desulfurization fields. In terms of materials, ceramic packing demand grows at 25% annually due to strong corrosion resistance, low maintenance, and long lifespan; metal packing market share has declined somewhat due to rising hazardous waste costs.
2. Material Selection Guide: 316L, PVDF, or Ceramic?
Core Material Properties Comparison
| Property | 316L Stainless Steel | PVDF Plastic | Ceramic |
|---|---|---|---|
| Max Temperature | ~450°C | ~150°C | >1000°C |
| Corrosion Resistance | Good for most chemicals, but sensitive to wet chlorides | Excellent, broad chemical resistance | Excellent, except to HF acid |
| Mechanical Strength | High strength and toughness | Moderate, good flexibility | High hardness, but brittle |
| Critical Weakness | Chloride stress corrosion cracking | High temperature creep | Brittle, sensitive to thermal shock |
| Ideal Applications | High temp/pressure, hydrocarbons, organics | Chloride/Fluoride wastewater, Li-ion battery, strong acids/bases | Coker desulfurization, high-temp gas scrubbing, phthalic anhydride |
| Economic Perspective | Standard choice, moderate cost | Best value for corrosive services, lowest lifecycle cost | Necessary for extreme conditions, high initial cost |
Selection Insight: 316L is suitable for chloride-free, high-temperature services; PVDF offers the best lifecycle cost in corrosive environments; Ceramic is essential for ultra-high temperature or extreme solvent applications. Decisions should be based on Total Cost of Ownership (TCO) analysis.
3. Energy Saving Retrofit: Detailed Performance Data
Performance Comparison: Before vs After Retrofit
Key Performance Improvements
| Steam Consumption: 6.5 → 4.2 tons/hour (-35%) |
| Product Purity: 98.5% → 99.7% (+1.2%) |
| Annual Maintenance: 2-3 → <1 shutdown (-67%) |
| Performance Metric | Before (Sieve Trays) | After (Structured Packing) | Improvement | Annual Impact |
|---|---|---|---|---|
| Steam Consumption | 6.5 tons/hour | 4.2 tons/hour | -35% | Saves $400,000 (at $25/ton) |
| Specific Energy | 1.18 tons steam/ton product | 1.00 tons steam/ton product | -15% | Core efficiency metric |
| Total Pressure Drop | 32 kPa | 6.5 kPa | -80% | Lower reboiler temperature |
| Solvent Loss Rate | 3.0% | 0.8% | -73% | Raw material savings |
| HETP | 0.8 meters | 0.3 meters | -62% | Better separation efficiency |
ROI Analysis: Financial Justification
| Benefit Category | Annual Value (USD) | Calculation Basis |
|---|---|---|
| Steam Cost Savings | $400,000 | (6.5 – 4.2) tons/hr × 8,000 hr/yr × $25/ton |
| Raw Material Savings | $600,000 | (3.0% – 0.8%) × 40,000 tons/yr × $6,000/ton |
| Maintenance Cost Reduction | $80,000 | Reduced shutdowns and maintenance |
| Increased Product Value | $100,000 | Higher purity product premium |
| Total Annual Savings | $1,180,000 | Sum of all improvements |
Return on Investment Analysis
4. Industry Benchmark Cases
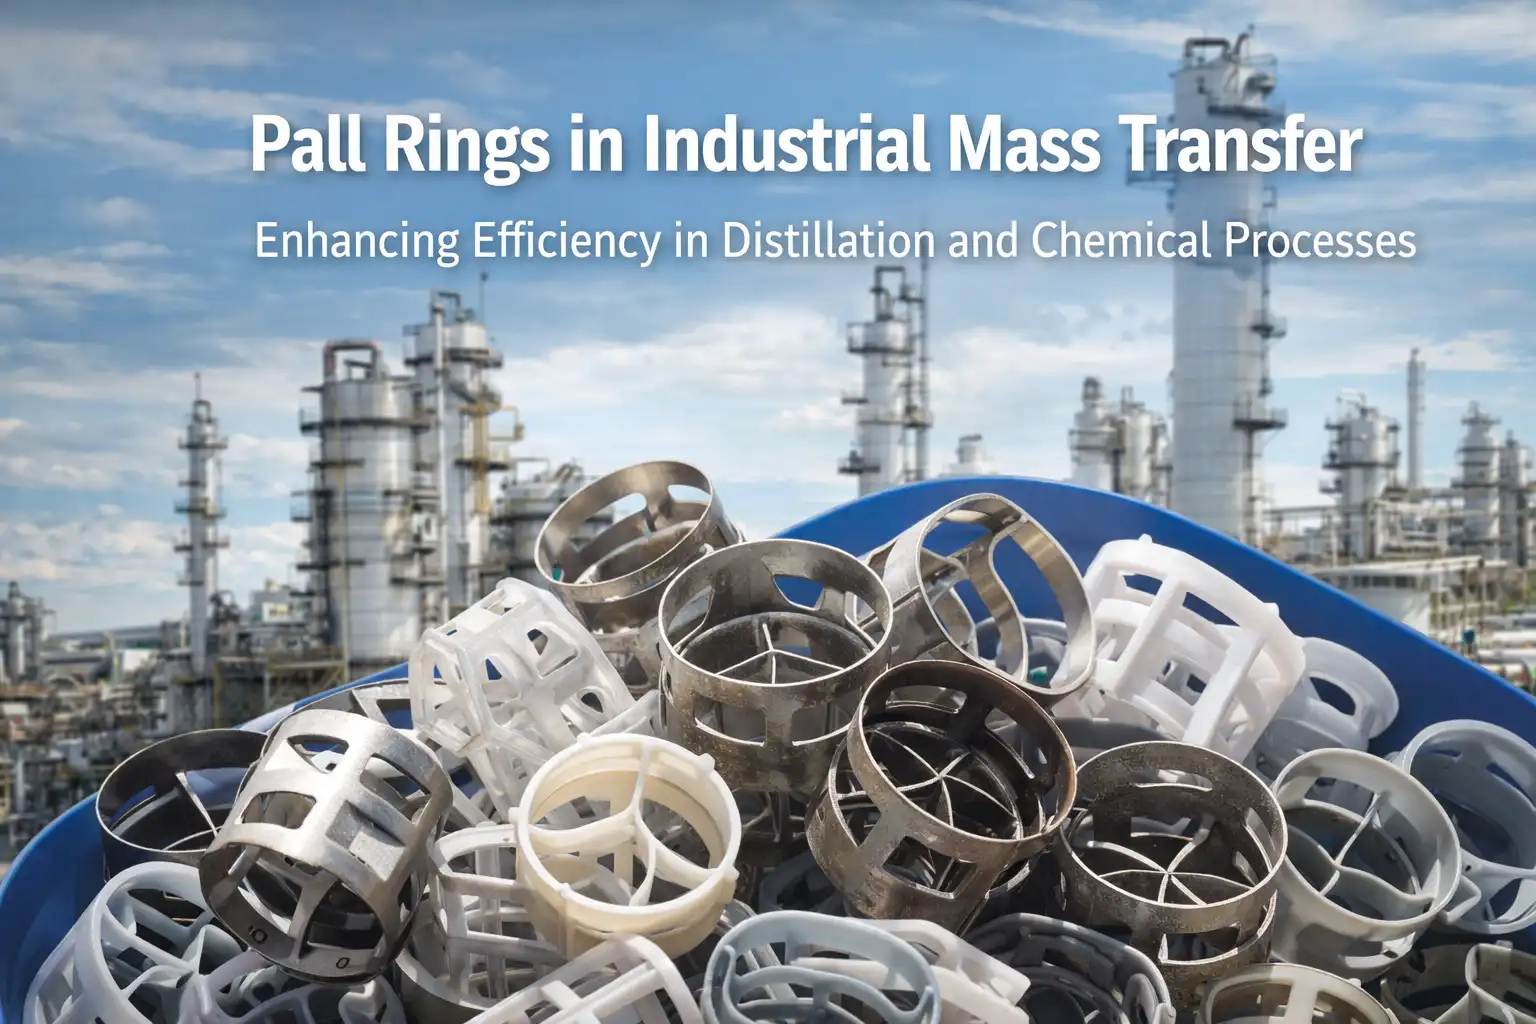
Case 1: Jilin Petrochemical Styrene Column Retrofit
Project Overview: Jilin Petrochemical’s styrene column with 3.2m diameter originally used metal Pall rings, producing 25,000 tons of styrene annually with 5% styrene content in the overhead ethylbenzene.
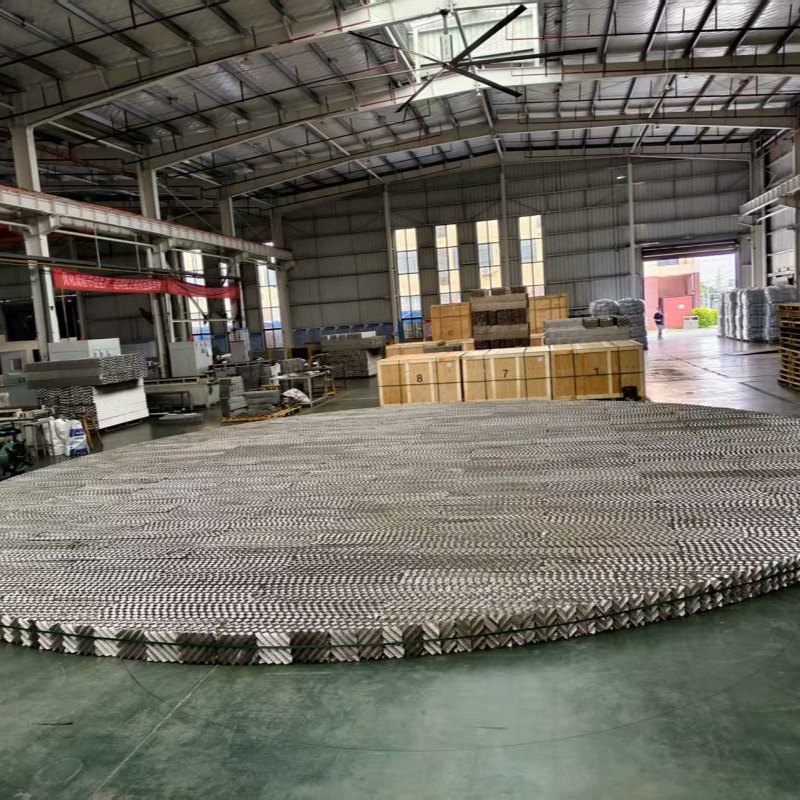
Retrofit Solution: Replaced with metal mesh corrugated packing and 125Y/250Y metal sheet corrugated packing.
Results:
- Styrene production increased to 60,000 tons/year
- Overhead styrene content reduced to 0.5-0.1%
- Bottom styrene purity >99.8%
- Total pressure drop: 7.33 kPa
- Reboiler temperature reduced from 104°C to 83°C
- Annual benefit: $1.5 million
Case 2: Changzhou Chemical Plant Styrene Column
Project Overview: 3,000-ton/year styrene column originally using valve trays.
Retrofit Solution: Replaced with sheet metal corrugated packing.
Results:
- Production doubled
- Specific consumption reduced from 1.18 to 1.13 tons/ton styrene
- Annual electricity savings: 612,000 kWh
- Annual water savings: 80,000 tons
- Annual steam savings: 18,000 tons
- Investment payback: 93 days
Case 3: Wanhua Chemical Nitric Acid Plant
Project Overview: 360,000-ton nitric acid “four-in-one” unit project using medium-temperature (420°C) waste heat recovery technology.
Results:
- Additional medium-pressure steam production: 0.217 tons/ton nitric acid
- Reduced low-pressure steam consumption: 0.131 tons/ton nitric acid
- Annual steam savings: 137,808 tons
- Annual coal savings: 12,800 tons standard coal
- Annual CO2 reduction: 35,500 tons
- Annual economic benefit: $2.5 million
Case 4: Henan Xinlianxin Methanol Distillation
Project Overview: 300,000-ton/year methanol distillation unit with original steam consumption of 1.05 tons steam/ton methanol.
Retrofit Solution: “Five-tower 3+3 effect” heat coupling process technology.
Results:
- Steam consumption reduced to <0.65 tons steam/ton methanol
- Ethanol content reduced to <10 ppm
- Average daily production: 1,142.28 tons (114.2% load)
- Annual operating cost savings: $2.7 million
- Investment payback: 10 months
5. Technical Comparison: Packing Performance
Structured Packing vs Trays: Key Parameters
| Performance Parameter | Metal Structured Packing | Sieve Trays | Advantage |
|---|---|---|---|
| Pressure Drop per Stage | 0.3-1.0 mbar | 5-10 mbar | 80-90% lower |
| HETP Range | 0.3-0.5 m | 0.6-1.0 m | 40-50% better efficiency |
| Turndown Ratio | 3:1 to 5:1 | 2:1 to 3:1 | Better flexibility |
| Liquid Holdup | 30-50% lower | Higher | Faster response |
| Capacity (F-factor)* | 2.8-3.6 Pa0.5 | 2.2-2.8 Pa0.5 | 20-30% higher throughput |
* F-factor = uG√ρG where uG is vapor velocity (m/s) and ρG is vapor density (kg/m3)
6. Technology Trends & Innovation Directions
Material Innovation Breakthroughs
Nanomaterial Applications
Nano-SiO2 coating technology significantly improves packing anti-fouling capability, with pH tolerance range expanded to 2-12.
Composite Material Development
Stainless steel + PTFE blend materials, PP+PTFE coating composite structure packing already account for 28% market share.
Smart Responsive Materials
Temperature/light-sensitive color-changing structured packing under development, enabling dynamic optimization.
Structural Design Optimization
3D Printing Customization
Through precise geometric parameter design, achieving optimal performance and cost-effectiveness.
Computational Fluid Dynamics Simulation
CFD technology supports complex corrugation, mesh, and hybrid element structure design, fine-tuning surface geometry at micro-scale.
Multi-stage Composite Structures
Integrated sensors for real-time monitoring of pressure differential, temperature, enabling intelligent operation and maintenance.
Green Manufacturing Transformation
Biodegradable Packing
PLA-based material application share expected to increase to 12%.
Production Energy Consumption Reduction
New production processes reduce energy consumption by 40% compared to traditional methods.
Waste Recovery Rate Improvement
Targeting 85% recovery and utilization rate.
7. Policy Environment & Compliance Requirements
In Q1 2026, driven by tightening environmental policies and increasing industrial energy conservation demands, the domestic chemical packing industry is accelerating its upgrade toward high efficiency, green manufacturing, and standardization.
Key Policy Requirements
- Energy Efficiency Standards: New packing production facilities must have energy consumption below 95% of baseline
- Emission Limit Tightening: VOCs emission limits 40% stricter than before
- Outdated Capacity Elimination: Approximately 34% of inefficient, high-consumption capacity facing elimination or mandatory upgrades
- Green Manufacturing Requirements: Greater emphasis on material environmental friendliness and recyclability in packing production
Regional Market Characteristics
| Region | Market Share | Growth Rate | Characteristics |
|---|---|---|---|
| Eastern China | 58% | 18% | Technology leadership, mature market |
| Central & Western China | 25% | 25% | Policy-driven growth, emerging market |
| Southeast Asia | 12% (export) | 40% | China’s packing exports growing rapidly |
8. Deepened ROI Analysis & Investment Insights
Payback Period Distribution Analysis
Based on statistical analysis of multiple successful cases, metal structured packing retrofit projects show the following patterns:
High energy cost, high steam price scenarios
Most common payback period
Complex process retrofit scenarios
Sensitivity Analysis of Influencing Factors
| Factor | Change | Impact on Payback Period |
|---|---|---|
| Steam Price | Increase by $10/ton | Shortens by 1.2 months on average |
| Annual Operating Hours | Increase from 6,000 to 8,000 hours | Shortens by 30% |
| Raw Material Price | Higher solvent prices | Greater proportion of savings from material conservation |